Table of Contents
Fitness
You can keep track of your fitness activities by downloading them from any supported device, eg. sport watch, fitness tracker, GPS-device, etc. You can analyse, see all details like heart rate, steps per minute, calories, track on map, different colour schemes, diagrams, etc.
Note that all your activities data are stored offline on your private disc, and are not shared with any cloud.
Devices
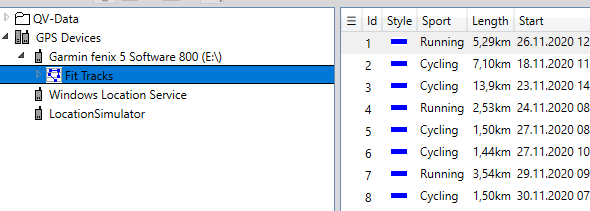
If you use a sport watch Garmin Fenix, connect it with USB to your Mac or Windows computer. Wait until Garmin Fenix appears in QVX Xplorer window, and then copy the selected activities into a track table of your choice. For further information on data transmission see here.
For any GPS-device recognized by QVX, the above procedure is applied.
For a GPS-device not recognized by QVX, use the software provided with your device to download your activities. Then export them in fit- or tcx-format to your hard drive and then import into QVX.
If you use the Apple watch, install on your Iphone an application which can read your activities (for example, HealthFit) and share them as a fit-file to your computer. Then import this fit-file into QVX.
For more information on importing files see here.
Analysing your data
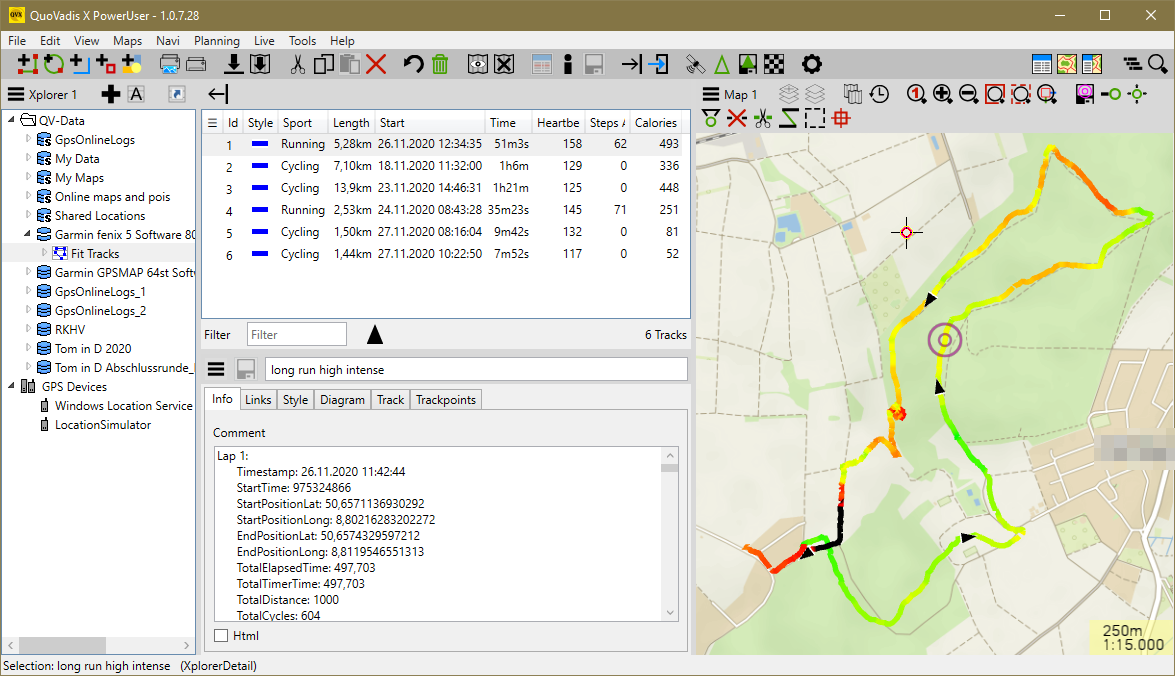
Click the options button  in the upper left corner of List window and select “Default fitness”. You will see Sport, Length, Start, Duration, Heartbeats Avg, Steps Avg, Calories data for each activity in the List window.
If you want to add or replace data, go back to the options button and choose from the drop-down menu.
You can analyse your data in different ways.
Click on the column header to sort your data in a progressive manner.
Go to Diagram section in Properties window, select the type of data you want to see on the diagram, click a section of the curve which interests you, and you will see it also in Map window.
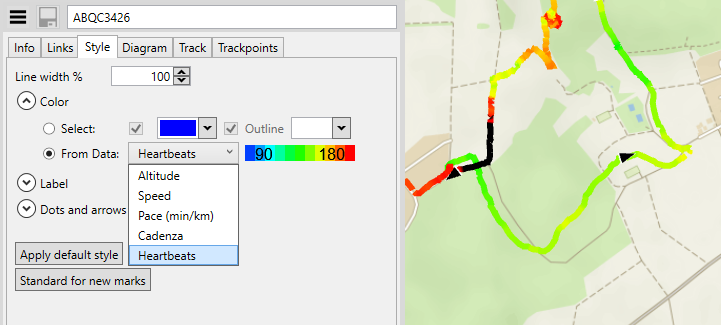
In Style section of Properties window you can choose the colour of your track through Select option.
Or you can monitor your activity parameters, like speed, altitude or heart rate etc, by selecting From Data option. In this case different values of these parameters will be presented in different colours where blue is the lowest, and red is the highest value.
![[Translate to English:] QuoVadis GPS](/fileadmin/_processed_/5/b/csm_QuoVadis-Logo_JTL_dadf090183.png)


